What Is Variance?
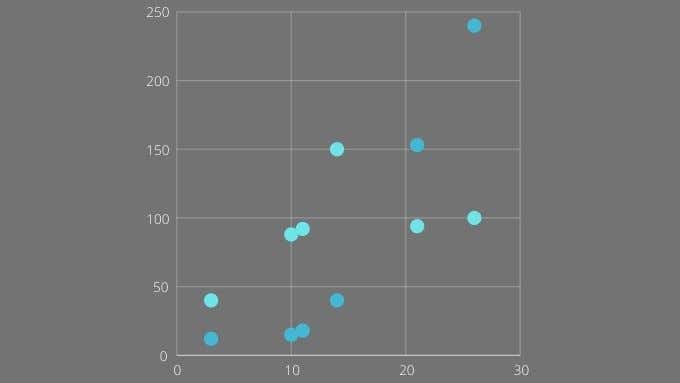
“Variance” is a way to measure the average distance from the mean. The “mean” is the sum of all values in a dataset divided by the number of values. Variance gives us an idea of whether the values in that data set tend, on average, to stick uniformly to the mean or scatter all over the place. Mathematically, variance isn’t that complex: So as you can see, it’s not a hard value to calculate. However, if you have hundreds or thousands of values, it would take forever to do manually. So it’s a good thing that Excel can automate the process!
What Do You Use Variance For?
Variance by itself has a number of uses. From a purely statistical perspective, it’s a good shorthand way to express how spread out a set of data is. Investors use variance to estimate the risk of a given investment. For example, by taking a stock’s value over a period of time and calculating its variance, you’ll get a good idea of its volatility in the past. Under the assumption that the past predicts the future, it would mean that something with low variance is safer and more predictable. You can also compare the variances of something across different time periods. This can help detect when another hidden factor is influencing something, changing its variance. Variance is also strongly-related to another statistic known as the standard deviation. Remember that the values used to calculate variance are squared. This means that variance is not expressed in the same unit of the original value. The standard deviation requires taking the square root of variance to return the value to its original unit. So if the data was in kilograms then the standard deviation is as well.
Choosing Between Population and Sample Variance
There are two subtypes of variance with slightly different formulas in Excel. Which one you should choose depends on your data. If your data includes the entire “population” then you should use population variance. In this case “population” means that you have every value for every member of the target population group. For example, if you’re looking at the weight of left-handed people, then the population includes every individual on Earth who’s left-handed. If you’ve weighed them all, you’d use population variance. Of course, in real life we usually settle for a smaller sample from a larger population. In which case you’d use sample variance. Population variance is still practical with smaller populations. For example, a company may have a few hundred or few thousand employees with data on each employee. They represent a “population” in the statistical sense.
Choosing the Right Variance Formula
There are three sample variance formulas and three population variance formulas in Excel:
VAR, VAR.S and VARA for sample variance.VARP, VAR.P and VARPA for population variance.
You can ignore VAR and VARP. These are outdated and are only around for compatibility with legacy spreadsheets. That leaves VAR.S and VAR.P, which are for calculating the variance of a set of numerical values and VARA and VARPA, which include text strings. VARA and VARPA will convert any text string to the numerical value 0, with the exception of “TRUE” and “FALSE”. These are converted to 1 and 0 respectively. The biggest difference is that VAR.S and VAR.P skip over any non-numerical values. This excludes those cases from the total number of values, which means the mean value will be different, because you’re dividing by a smaller number of cases to get the mean.
How to Calculate Variance in Excel
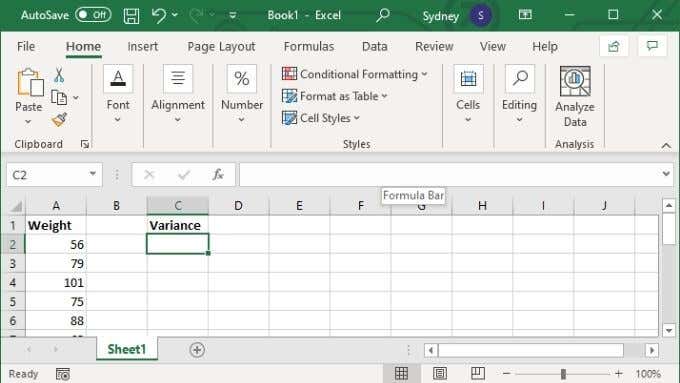
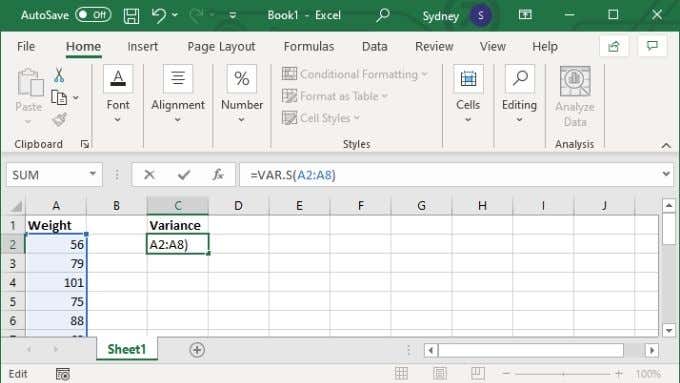
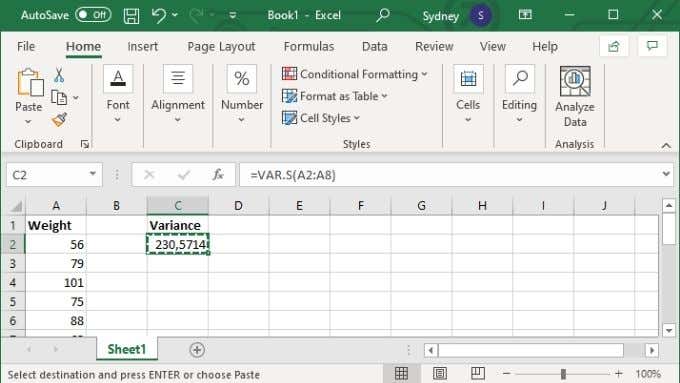
All you need to calculate variance in Excel is a set of values. We’re going to use VAR.S in the example below, but the formula and methods are exactly the same regardless of which variance formula you use: Alternatively, you can specify specific values, in which case the formula looks like =VAR.S(1,2,3,4). With the numbers replaced with whatever you need to calculate the variance of. You can enter up to 254 values manually like this, but unless you only have a handful of values it’s almost always better to enter your data in a cell range and then use the cell range version of the formula discussed above.
You Can Excel at, Er, Excel
Calculating variance is a useful trick to know for anyone who needs to do some statistical work in Excel. But if any of the Excel terminology we used in this article was confusing, consider checking out Microsoft Excel Basics Tutorial – Learning How to Use Excel. If, on the other hand, you’re ready for more, check out Add a Linear Regression Trendline to an Excel Scatter Plot so you can visualize variance or any other aspect of your data set in relation to the arithmetic mean.


