But if your system has some issues, this value can be unreasonably high. If your system starts becoming sluggish or the fan speed increases without reason, it’s likely due to high CPU usage. In such scenarios, you must check the current CPU usage and see if any processes are liable. Depending on your OS, various ways to check the CPU usage exist. They offer different options, so check the methods we have provided and pick one according to your preference.
How to Check CPU Usage on Windows
Most users often use GUI tools such as Task Manager or Resource Monitor to check CPU usage on Windows OS. But you can also use command-line interfaces such as PowerShell.
From the Task Manager
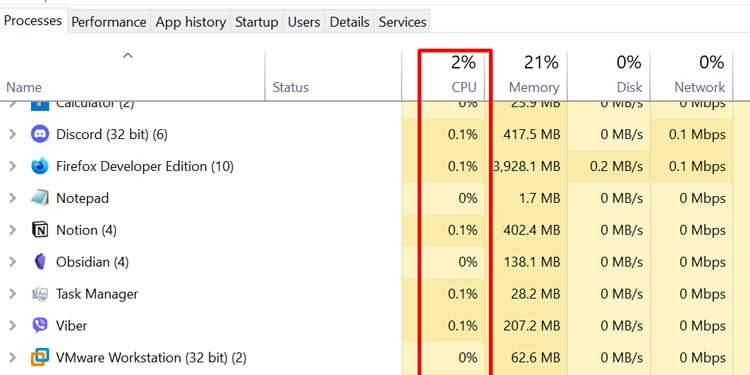
The Task Manager is the most common program to check CPU usage. It provides somewhat brief information on this data, which is sufficient for most users. There are many ways to open the Task Manager. The easiest method is to press the Ctrl + Shift + Escape hotkey. On the Processes tab, You can go to the Details tab to get more information on CPU utilization. Here, The CPU column shows the CPU usage across all cores for individual processes. And the CPU time shows the total processor time a process has been using since its launch. CPU time of a process = Process uptime * CPU utilization of the process. So, if a process runs for 2 hours while using 50% CPU, its CPU time shows 1 hr. The System Idle Process shows the free processor time on your PC. So, if its value is very high, your system is using only a small percent of the CPU processing capacity to run active processes. You can also check the total CPU utilization for the last minute from the Task manager’s Performance tab. Clicking on CPU shows the graph for its activity along with details on usage, active processes, and threads. Also, right-clicking on the graph and selecting Change graph to > Logical processors shows the CPU activity for all logical processors. Logical processors are the virtual cores your system uses after hyper-threading the physical ones.
Using the Resource Monitor
The Resource Monitor offers more detailed information on CPU utilization. First, open the Resource Monitor using the steps below: Then, go to the Overview tab. Here, For more information on CPU utilization, go to the CPU tab. Here, you can check the CPU usage and time for all active apps and services. On the right, you can also find graphs on the CPU activity for the past 60 seconds. It contains graphs for the total core activity as well as for individual cores.
Using the Performance Monitor
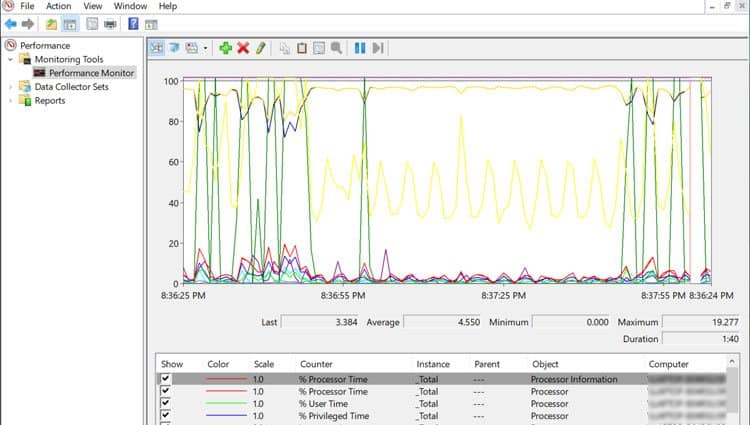
You can also check CPU usage using the Performance Monitor. However, people use this tool to find the most detailed information on system processes affecting the CPU, not user applications. To check the CPU usage with this program, Here you can see the real-time graph of the processor time percentage of your system. You can also add counters to track CPU usage for a single process or instance. To do so,
Using Command-line Interface
You can also use CLI tools to check CPU usage. In fact, using the CLI might be a better option for users familiar with such interfaces, especially if they want to use the data elsewhere. The best Windows CLI tool you can use to check CPU usage is Windows PowerShell. It has more functionalities, and everything you can do in other terminals is also possible in PowerShell. First, open Windows PowerShell by entering powershell on Run. Then enter the commands below according to your need. Total CPU usage: You can also run this command with an infinite loop to check CPU load every second. The command is:While(1) { Get-CimInstance win32_processor | Measure-Object -Property LoadPercentage -Average} Press Ctrl + C to get out of the infinite loop. CPU Usage for each active process: The command you need is as follows: The number after Select-Object -First, 25 in this case, specifies the number of instances the list will show. You can change it according to your preference. You can also use the command with the infinite loop to check CPU usage every second.
How to Check CPU Usage on Linux
Most Linux users should already be familiar with the top command to monitor their apps and processes. But most Linux systems also contain a System Monitor GUI. This section describes how you can check CPU usage using both methods.
Using the Terminal
The top command lists all active processes with CPU load, memory usage, and other information. The list shows real-time information that refreshes constantly. You also use the following switches along with the top function:
-i – hides idle processes (top -i)-d – specifies the delay time in seconds for refreshing the data (top -d 10).
You can also use other commands like sar –u 5 and iostat to display average CPU usage. While using sar, the number 5 represents the display refresh rate. You need to press Ctrl + C to end the function.
q – end the top functionp – sort processes by CPU usagek – end process; you need to enter the PID of the process to killn – change the number of processes in the list
Using the Gnome System Monitor GUI
Here’s how you can use the Gnome System Monitor on Linux to check CPU usage:
How to Check CPU Usage on Mac
Mac is a UNIX-based system. So the methods to check app activity are very similar to that of Linux. You can either use the Activity Monitor or the top command.
Using the Activity Monitor
The usual way to check CPU usage on Mac is through the Activity Monitor. Here are the necessary steps for the method:
Using the Terminal
You can also use the top command on the Mac Terminal to check your activities. The use of this command is similar to that of Linux, so check it out for more information. To end the function, press the Ctrl + C keys.
Related Questions
How to Fix High CPU Usage?
You can usually fix high CPU usage by ending the unnecessary apps or processes. But in case of some system issues, you might need to apply some advanced solutions. To find the solutions, check out our articles on How To Lower High CPU Usage or How to Limit CPU Usage.


